This article highlights the five major historical trends of the Jain population in India in modern times in terms of (i) the size, (ii) its share/proportion in the total population of India, (iii) decadal growth rate, (iv) urbanization, and (v) sex ratio. It is based on the Indian census data, and deliberately avoids here discussing the problem of under-enumeration of the Jain population as that can be the subject-matter of a separate article.
Of the six major religious communities in India that have been systematically enumerated since the first census in 1881, the Jains have always been the smallest one. In 1881 the Jain population was enumerated at 1,221,896, or 0.48 percent of the total Indian population. Since then the Jains have seldom constituted more than half-a-percent of the total population of India (See the Table below). With a population of 4.45 million (0.37%) in the 2011 census, the Jains continued to constitute the smallest religious community in the country. The corresponding figures for other religious communities were: Hindus 966.62 million (79.80%), Muslims 172.2 million (14.23%), Christians 27.80 million (2.3%), Sikhs 20.8 million (1.72%), Buddhists 8.44 million (0.7%), other religious communities including Parsis 10.8 million (0.89%).
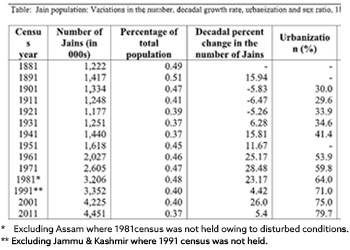
During the decade 1881-1891 Jain population did increase by about 16% but went on declining in the 1901, 1911 and 1921 censuses, perhaps mainly due to Jains’ drift towards Hinduism and their incorrect enumeration. The 1891 level of the Jain population was restored only in 1941. Since then and until 1981 the Jain population had been increasing continuously at varying rates ranging from 12% to over 28% per decade. Between 1981 and 1991 the Jain population grew by only 141, 065 persons, or by 4.42%. This was one of the lowest decadal growth rates in the Jain population since 1921.
When most demographers were expecting less than 4% population growth rate of the Jain population in the 2001 census, they were surprised to discover that it turned out to be over 26% during the decade 1991-2001. Two factors may be responsible for this: (i) “ethnic revivalism” that resulted from the ethnic Jain media exhorting the Jains since the early-1990s to return their religion as Jainism, and (ii) an administrative reform in 2001 census whereby the respondents were allowed to look at the information collected from them by enumerators and sign the forms after verifying that they were to their satisfaction. This was the first time this procedure was followed. Earlier, many of the enumerators might have recorded Jains as Hindus. But with the respondents verifying and signing the forms, they would have insisted on being registered as Jains and not Hindus.
Notwithstanding the second highest decadal growth rate among Jains in the 2001 census enumeration, their birth rate continues to be low. This can be attributed to the decline in fertility rate since at least the 1980s due to affluence among the Jains owing to their urban middle class status. Female child diksha and discouragement of widow remarriage in the community could also be the contributing factors. The decadal growth rate of the Jain population during 2001-2011 period at 5.4% clearly confirms this trend.
Jains have been the most urbanized community since the very beginning of the 20th century and continues to be so with about 80% of its population living in the cities and towns of India in 2011 census. Presently about 85% of the Jain population is likely to be residing in urban areas of the country.
Sex ratio in India is defined as the number of females per 1000 males in the population. As can be seen in the accompanying table, the sex ratio in the Jain population since at least the census year 1901 has been skewed in favour of the male members. It ranged from 924 in 1961 to 954 in 2011, and averaged to 943 during the period 1901-2011. The sex ratio among the Jains declined from 846 in 1991 to 940 in 2001, but considerably improved in 2011 census with 954 females per 1000 males. The all-India sex ratio in 2011 was 943.
Child sex ratio is another indicator of gender equality in a community or society It is defined as the number of females in age-group 0-6 years per 1000 males in the same age-group in the population. Among the Jains, the child sex ratio was 879 in 2001 compared to 927 for all religious communities in India. In 2011, the child sex ratio in the case of the Jains was 889 which is not an appreciable figure against the all-India average of 918. In the absence of any study on the subject, the causes of low sex and child sex ratios among the Jains are not easy to find. Apparently, the prevalence of female feticides could be one factor in this regard. Needless to say, this decline in the sex ratios has begun to give rise to a number of marital and social problems among the Jains that in turn have been contributing factors in lowering the sex ratios – a vicious circle indeed.
To sum up, the 2011 census not only enumerated the largest Jain population ever in modern times at about 4.5 million, it also revealed for the first time in the Indian census history that the Jain population was spread all over the country – in all the states and union territories in India. Other demographic features included about 5.4% decadal growth rate during 2001-2011, urbanization 80%, sex and child sex ratios 954 and 889 respectively, fertility rate 1.6 persons, literacy rate 94.88% (male 96.78% and female 92.91%), and work participation rate 35.53% (male 57.71% and Female 12.27%). Overall, these data clearly highlight the urban middle-class character of the Jain community.
Table: Jain population: Variations in the number, decadal growth rate, urbanization and sex ratio, 1881-2011
| Census
year |
Number of Jains (in 000s) | Percentage of total population | Decadal percent change in the number of Jains | Urbanization (%) | Sex Ratio |
| 1881
1891 1901 1911 1921 1931 1941 1951 1961 1971 1981* 1991** 2001 2011 |
1,222
1,417 1,334 1,248 1,177 1,251 1,440 1,618 2,027 2,605 3,206 3,352 4,225 4,451 |
0.49
0.51 0.47 0.41 0.39 0.37 0.37 0.45 0.46 0.47 0.48 0.40 0.40 0.37 |
–
15.94 -5.83 -6.47 -5.26 6.28 15.81 11.67 25.17 28.48 23.17 4.42 26.0 5.4 |
–
– 30.0 29.6 33.9 34.6 41.4 – 53.9 59.8 64.0 71.0 75.0 79.7 |
–
– 929 940 931 940 930 927 924 940 941 946 940 954 |
* Excluding Assam where 1981census was not held owing to disturbed conditions.
** Excluding Jammu & Kashmir where 1991 census was not held.
Source: Prakash C. Jain, Studies in Jain Population and Demography,
Rawat Publications, Jaipur and New Delhi, 2019, p. 155.

[…] [1] Prakash C Jain, “Jain Population in India – Some Historical Trends – Jainavenue,” JAIN POPULATION IN INDIA – SOME HISTORICAL TRENDS, November 2, 2020, https://jainavenue.org/jain-population-in-india-some-historical-trends/. […]
tadalafil tablets ip 20 mg
Jain Population in India – Some Historical Trends – Jainavenue
custom essay writer
Jain Population in India – Some Historical Trends – Jainavenue
personal essay writers
Jain Population in India – Some Historical Trends – Jainavenue
best custom essays
Jain Population in India – Some Historical Trends – Jainavenue
buy essay online cheap
Jain Population in India – Some Historical Trends – Jainavenue
help essays
Jain Population in India – Some Historical Trends – Jainavenue
cheap custom essay writing services
Jain Population in India – Some Historical Trends – Jainavenue
essay writing service legit
Jain Population in India – Some Historical Trends – Jainavenue
help me write my college essay
Jain Population in India – Some Historical Trends – Jainavenue
premium essay writing service
Jain Population in India – Some Historical Trends – Jainavenue
essay editing service reviews
Jain Population in India – Some Historical Trends – Jainavenue
where can i buy essays online
Jain Population in India – Some Historical Trends – Jainavenue
Who wants to write my essay
Jain Population in India – Some Historical Trends – Jainavenue
custom essay writing canada
Jain Population in India – Some Historical Trends – Jainavenue
law school essay editing service
Jain Population in India – Some Historical Trends – Jainavenue
custom essay company
Jain Population in India – Some Historical Trends – Jainavenue
valium pharmacy online
Jain Population in India – Some Historical Trends – Jainavenue
pharmacy mall online reviews
Jain Population in India – Some Historical Trends – Jainavenue
restore rx pharmacy
Jain Population in India – Some Historical Trends – Jainavenue
fda approved online pharmacy
Jain Population in India – Some Historical Trends – Jainavenue
how much is adipex at the pharmacy
how much is adipex at the pharmacy
tadalafil and sildenafil taken together
tadalafil and sildenafil taken together
buy genuine viagra online canada
buy genuine viagra online canada
cialis discount pharmacy
cialis discount pharmacy
cialis dosage 40 mg
cialis dosage 40 mg
viagra 4 tablets
viagra 4 tablets
can i buy viagra over the counter in mexico
can i buy viagra over the counter in mexico
buy viagra over the counter usa
buy viagra over the counter usa
cialis l\’espresso
cialis l\’espresso
best viagra for women
best viagra for women
cialis generic 2017
cialis generic 2017
india viagra tablets
india viagra tablets
cialis daily side effects
cialis daily side effects
what does cialis do
what does cialis do
pharmacy lexapro vs celexa
pharmacy lexapro vs celexa
which pharmacy carry oxycodone 30 mg
which pharmacy carry oxycodone 30 mg
where can i buy viagra uk
where can i buy viagra uk
buy 10 mg cialis
buy 10 mg cialis
cialis otc usa
cialis otc usa
viagra pills online canada
viagra pills online canada
sell of cialis
sell of cialis
humana rx pharmacy
humana rx pharmacy
buy viagra online with paypal
buy viagra online with paypal
can i buy female viagra over the counter
can i buy female viagra over the counter
viagra for women price
viagra for women price
generic viagra online pharmacy india
generic viagra online pharmacy india
viagra in india online
viagra in india online
buy generic viagra in us
buy generic viagra in us
cialis purchase
cialis purchase